

Key Takeaways
- As per SHRM's 2025 Benchmarking Report, the average U.S. time-to-fill roles has increased by up to 24%, highlighting the rising cost of a slow hiring process.
- The McKinsey HR Monitor 2025 found that offer acceptance rates among candidates remain around 56%, with 18% new candidates leaving during the probation period.
- According to the data, organizations relying on the AI-powered recruitment tools report 31% faster hiring times and a 50% improvement in quality of hire metrics, but only with the right metrics tracking.
- The majority of the HR teams keep a track of two or three-level metrics, while the successful ones check speed, quality, cost, and candidate experience.
- Instead of just improving individual recruitment metrics, AI helps stabilize relationships and address potential issues in manual hiring processes.
- Tracking more than 7 or 8 KPIs often creates noise for the TA & HR teams, with distraction from the core goal of making faster decisions.
Why Most HR Teams Are Measuring the Wrong Things
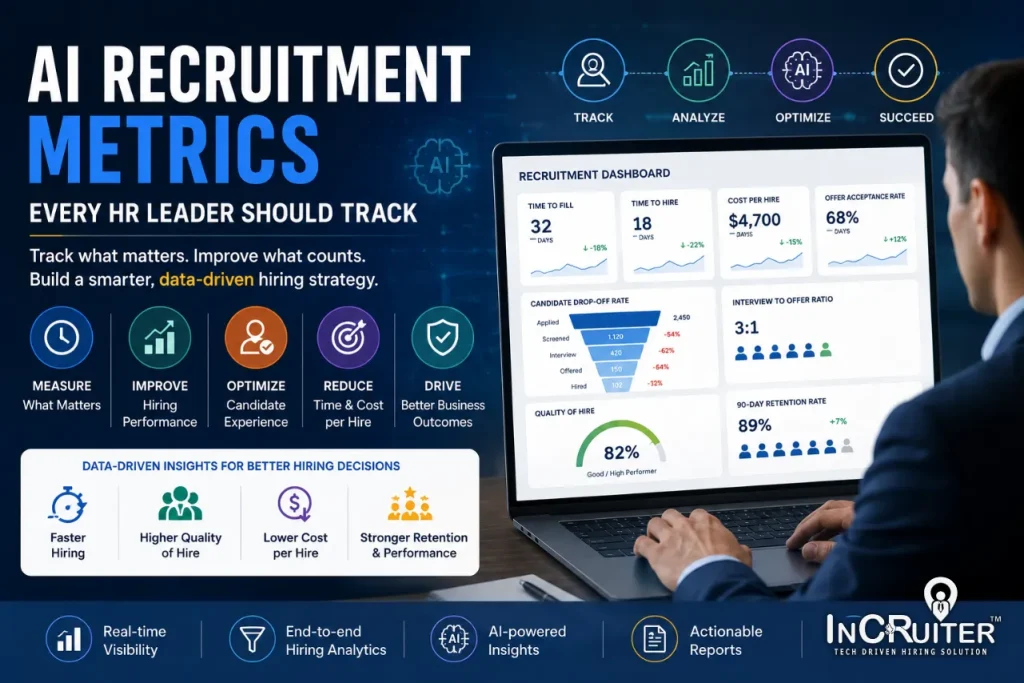
Let’s start with a question: what if the recruiting team hit its time-to-fill target last quarter, but a significant portion of them left within 3 months? Do you think it was actually a good quarter in terms of hiring milestones? The majority of the HR dashboards might claim that role-filling is a success. However, instead of success, this is one of the central problems with organizations if they fail to check the recruitment metrics. The ideal recruitment dashboard should give comprehensive details like the number of roles, the speed of hiring, and the cost of hiring candidates, along with a connection to the actual business outcomes.
In reality, the candidate who leaves within three months is a failed hire that costs you money and effort. In 2026, the recruitment success is measured by how long the employees stay instead of hiring speed. Another report highlights that companies with reliable retention programs end up offering 53% higher productivity and 50% faster time to hire. In this blog, let’s learn more about the importance of hiring KPIs and which one actually provides a clear picture.
The Core Recruitment Metrics HR Leaders Must Track
1. Time to Fill vs. Time to Hire
While these two recruitment metrics seem the same, they provide different insights related to your hiring journey. Time to fill measures the total number of days from when a job opens until a candidate accepts the offer, showcasing the overall hiring capacity. On the other hand, the time to hire candidates highlights when a specific candidate enters the system until they accept the offer. In simple words, it shows how efficiently your hiring process moves when you find a good candidate.
The advanced AI-powered recruitment software solves the problem of manual screening with automation in the initial rounds of interviews. This reduces the hiring delays and moves the shortlisted candidates to the next stage in a matter of hours. On the other hand, the talent acquisition analytics in the traditional hiring approach or old system shows the process taking days.
2. Cost Per Hire
As per SHRM’s 2025 data report, the average cost to hire a candidate remains around $4700. However, this number majorly covers agency fees, job board costs, and recruiter time. However, it usually misses the cost of an unfilled role, the productivity loopholes, and the expenses of a bad hire.
Calculating cost per hire for candidates becomes highly simple with the following formula –
Cost per hire = (Internal recruiting costs + External recruiting costs) ÷ Total hires in the period
The automated screening of AI hiring platforms reduces the dependency on the expensive external agencies and saves the manual recruiter hours. In simple words, it focuses on higher-value work while saving manual recruiter time.
3. Quality of Hire
This is one of the most essential hiring KPIs for hiring staff to keep an eye on. In reality, the employee retention rate is directly a signal of the hiring quality. To calculate the quality of the candidate hiring score, the TA teams rely on the following factors –
- The satisfaction ratings from managers at 30, 60, and 90 days.
- Periodic and timely candidate performance review scores.
- 90-day and 12-month retention rates.
The AI tools create customized interviews for every candidate to score them based on long-term performance and retention data. This allows the hiring staff to have a clear idea of which interview criteria can actually predict the real success in hiring quality.
4. Offer Acceptance Rate
As per various market research reports, around half of the job offers from the organizations get rejected. This low offer acceptance rate is because of three core hiring issues, such as low salary, slow interview experience, and slow offer generation.
The automated scheduling tools powered with artificial intelligence reduce the gap between the final interview and the offer to the candidates. These consistent updates keep the applicants engaged so they don’t go to other competitive offers.
5. Candidate Drop-Off Rate by Stage
A serious problem with most of the hiring software is that they keep losing candidates silently. The applicants come into the system, remain quiet, and the recruiter simply assumes that they took another job. In one way, this aspect of talent acquisition analytics highlights where exactly the system is leaking.
The most common candidate drop-off scenarios can occur between application and first contact from the company or between the final interview and offer. The AI-powered hiring solution highlights the candidate drop-offs instantly. The automated follow-up tools quickly re-engage candidates before they even lose interest.
6. Interview to Offer Ratio
As per the market data, the standard benchmark for interview-to-offer ratio remains 3:1. This means that you need to interview three candidates to make an offer to one. The higher the interview ratio, the higher the chances that your screening process is not filtering candidates in the proper manner.
The AI-based scoring of the candidates follows the pre-defined parameters set by the organization to avoid the interviewer bias. This creates a more seamless and better candidate shortlisting process to ensure effective final interviews.
The Metrics That AI Makes Visible for the First Time
| Metric | What It Measures | How AI Helps |
| Time to Fill | The total time taken to fill an open jon role | AI screening completes first-round interviews and scoring in hours instead of days |
| Time to Hire | Speed from a candidate’s application to accepting the final offer | Automated interview scheduling removes slow email coordination |
| Cost Per Hire | Total money spent to hire one person in the organization | Reduces manual working hours and cuts down on recruitment agency fees |
| Quality of Hire | New employee performance, stay duration, and manager satisfaction | AI scorecards match interview performance with long-term job success |
| Offer Acceptance Rate | Percentage of candidates who accept the job offer | Faster processes and constant updates keep top candidates engaged |
| Drop-Off Rate | The specific interview stages where candidates quit the process | Real-time dashboards instantly show exactly where candidates lose interest |
| Interview to Offer Ratio | The quality of candidates sent to the final rounds | Standardized AI scoring sends better & highly qualified shortlists to managers. |
| 90-Day Retention Rate | The percentage of new hires who stay past three months | AI data spots specific evaluation patterns that lead to higher retention |
How InCruiter Gives HR Leaders Visibility Into All of These Metrics
In 2026, there are various AI recruitment software providing data, but that’s usually disconnected from candidate evaluation. With InCruiter, you get recruitment metrics to make the right decisions for the right talent and streamline the hiring processes. An inbuilt AI interview software like InCruiter IncBot scores candidates on the basis of skills, responses, and other performance parameters. The automated scheduling tool, like InCruiter IncFeed, avoids any kind of gaps in the interviewer and candidate coordination delays. This impacts the hiring speed and offer acceptance rates by moving the right candidates to the next stage.
If your team needs support with tracking interview quality and screening consistency, the interview-as-a-service platform like InCruiter IncServe takes away the burden. With expert interviewers available instead of your internal team, you can easily hire and retain the senior and mid-level candidates. InCruiter’s recruitment software offers real-time dashboards with clear visibility into the hiring time, candidate drop-offs, progress updates, and engagement data without manual intervention. In simple words, the HR & TA teams get a continuous view of progress on what’s working, what’s not working, and which stages need automation and optimization.
If your hiring drive dashboard just offers the time-to-fill and cost-per-hire metrics, book a demo with InCruiter to experience what full-funnel talent acquisition analytics actually looks like.
Frequently Asked Questions
What are recruitment metrics and why do they matter?
Recruitment metrics are data points for HR & TA teams to assess how their hiring drives are performing at each stage of the process. Since hiring decisions directly impact business decisions, you need to clearly understand the key aspects in the recruitment phase. Some of these can be a slow hiring process, loss of top candidates, low-quality candidates, and high early attrition rates. With the appropriate visibility into essential metrics, the hiring team and leaders can make quicker and better decisions before finalizing any candidates.
What is the most important recruitment KPI for HR leaders to track?
Quality of candidates is one of the most important hiring KPIs as it translates into future benefits for businesses. The new employee stays for a longer time or leaves early within a few impacts impacts the business outcomes to a huge extent. Earlier, the hiring teams used to just focus on the time-to-fill and cost-per-hire, but those are just numbers without relevance to quality hiring and expenses in the recruitment drives.
How does AI improve talent acquisition analytics?
Artificial Intelligence-powered software offers candidate evaluation data that manual teams couldn’t gather on a consistent basis. With AI tools, you get organized scoring, responses, screening consistency signals, and overall performance recruitment metrics. With such valuable data quickly available, the HR teams can quickly close positions along with seamless employee engagement. At the same time, the AI-powered platforms’ real-time tracking of time-to-hire and drop-off rate to find and solve the bottlenecks without impacting the hiring progress.
What is a good offer acceptance rate benchmark?
As per McKinsey HR Monitor 2025, the current offer rate acceptance remains around 56%, which means around half of the offers are being declined. However, the healthy offer acceptance rate is around 80% in most industries. In case your organization’s hiring drive is not able to deliver effective offer acceptance rates in regard to these numbers, there is some serious issue in the background, like compensation structure, candidate experience, or timing.
How many recruitment metrics should an HR team track?
Usually, the HR teams need to keep an eye on around eight to ten metrics suitable for the organization’s hiring policies. Including non-essential metrics in reporting dashboards creates more confusion and distraction without adding decision value. The most effective recruitment metrics can be from pipeline speed, hire quality, cost efficiency, and conversion output. Every metric of the hiring process should be connected to the final decision scope.
Ready to Transform Your Hiring Process?
Discover how our AI-powered interview platform can streamline your recruitment and find the best candidates faster.

Related Blogs

AI Interview Software for Banking and Financial Services Hiring
Why BFSI Hiring Is Structurally Different From Every Other Sector Like other industries, the BFSI sector faces a lot of hiring challenges because of the...
Top 10 Best AI interview Software for Hiring in 2026
Work will become optional, we agree entirely with Elon Musk’s words, owner of xAI (Artificial Intelligence). Having witnessed in 2025 that 88% of white-collar jobs,...

Interview Management System: How to Choose the Right Tool For Your Business
This guide helps you choose the perfect interview management system for your business by evaluating key features, integrations, and hiring needs.

Discover the Leading AI Powered Interview Platforms Today
Finding the right talent is one of the most critical – and time-consuming – challenges any organization faces. Thankfully, AI-powered interview platforms are reshaping recruitment...
How Interview Scheduling Software Eliminates Recruiter Bottlenecks: A 2026 Buyer’s Guide
According to the SHRM Talent Access Report, the mean time for the filling of a post has reached 42 to 54 days, and the scheduling...
What Is an AI Recruiter? How Autonomous Hiring Agents Are Changing Talent Acquisition
“What is an AI recruiter?” An AI Recruiter refers to the autonomous virtual team member that performs the initial phases of the recruiting process autonomously....


